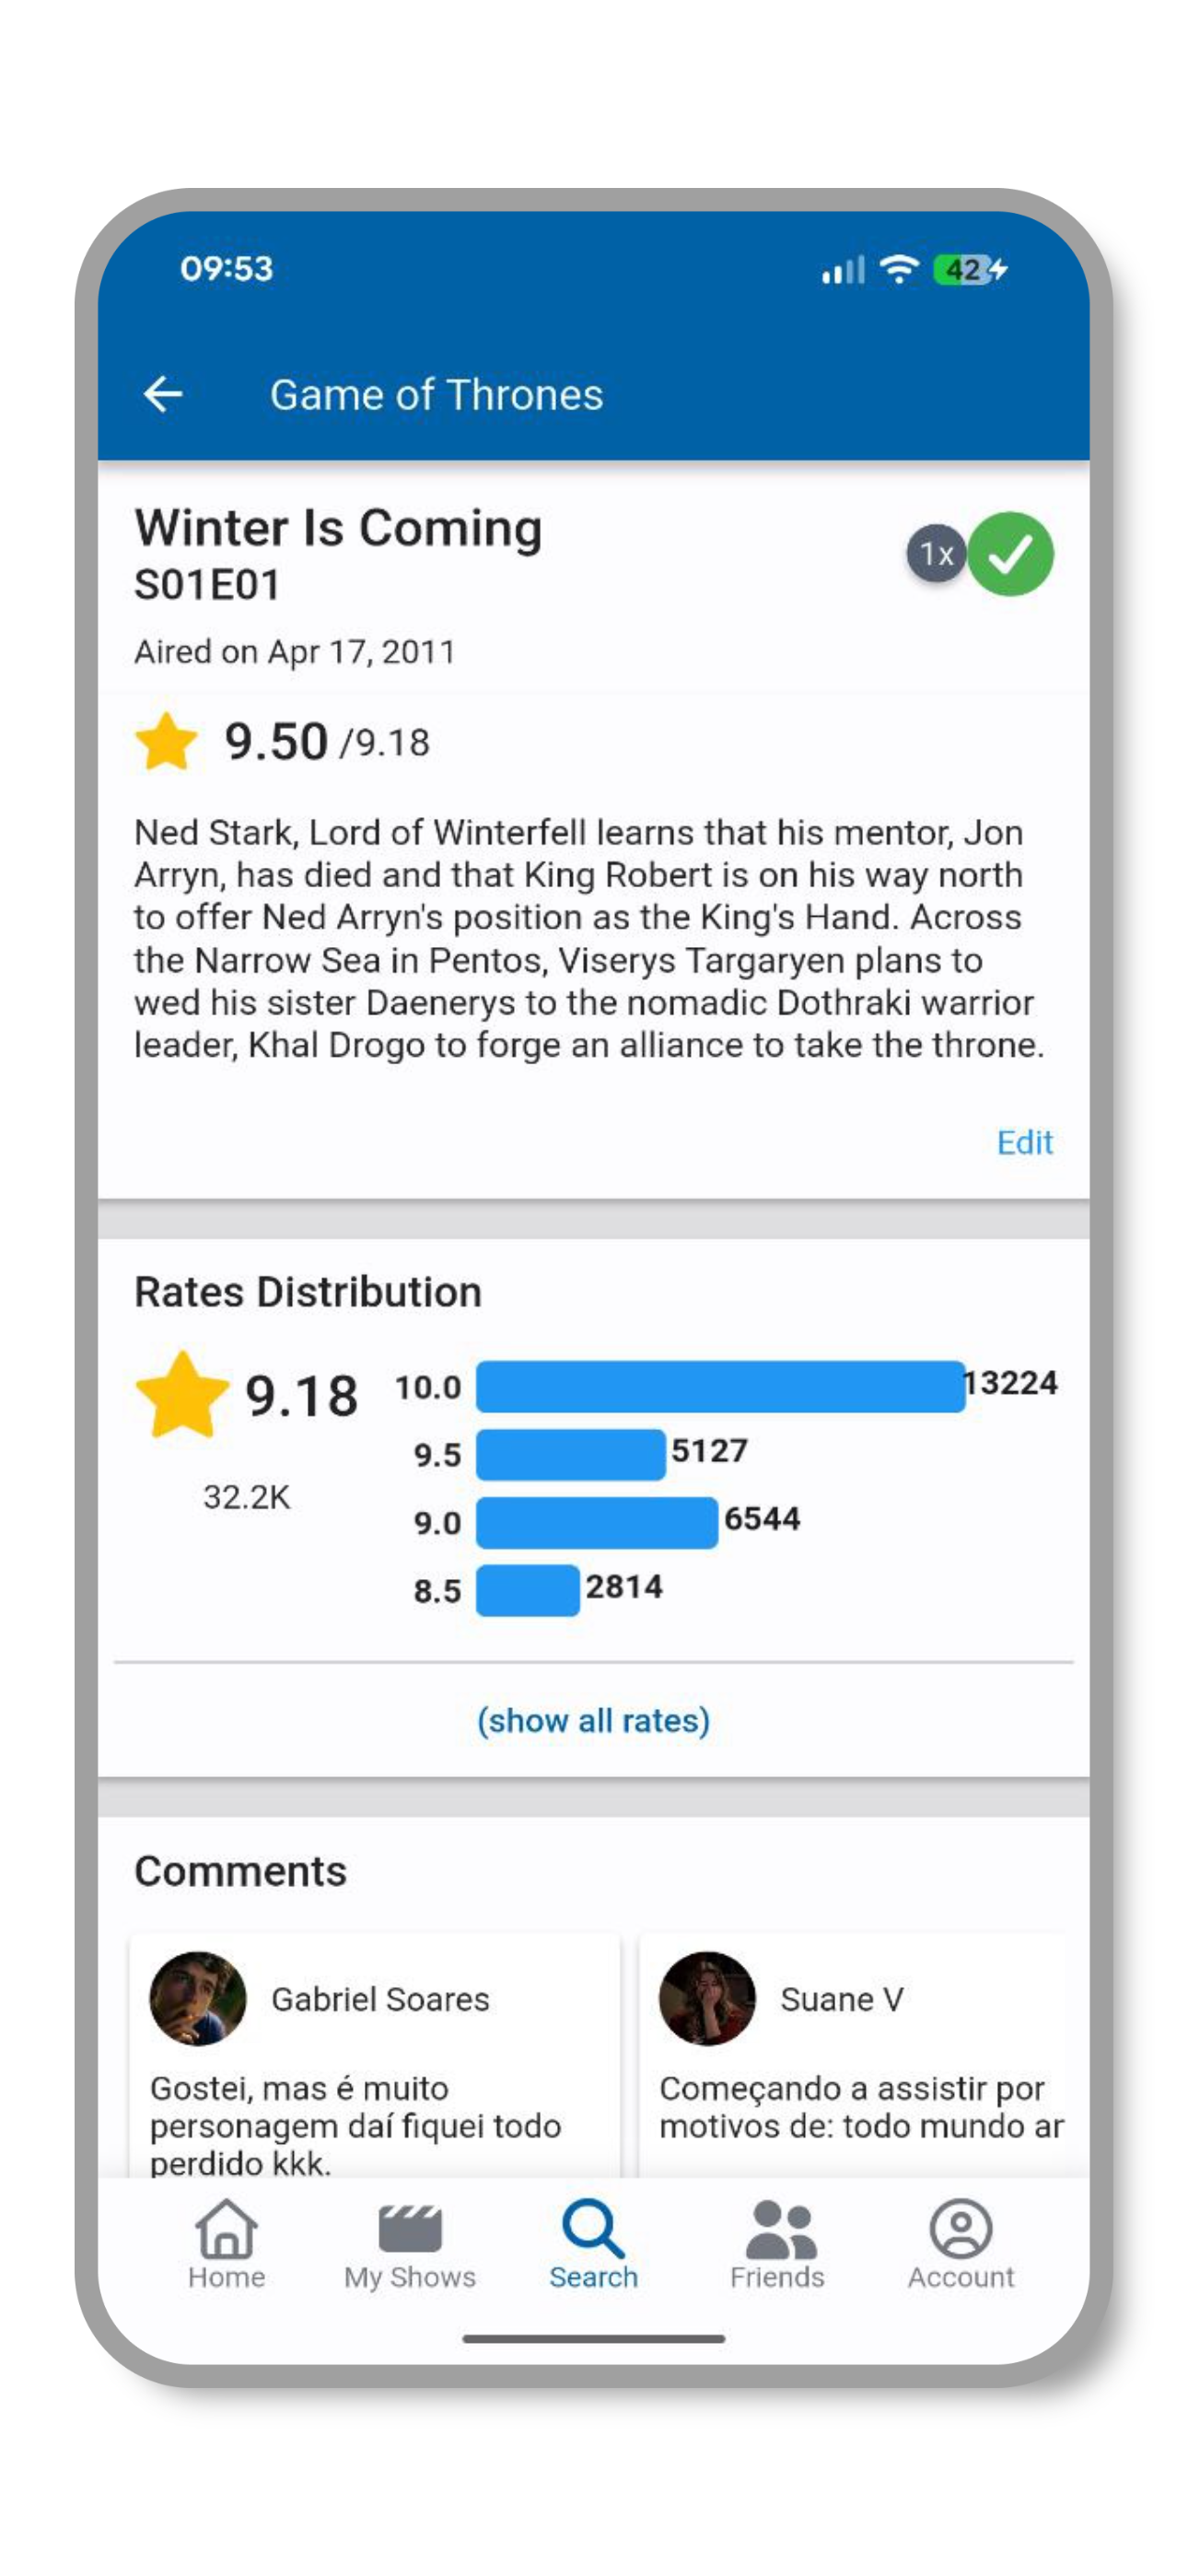
Rates Distribution
Introducing Rates Distribution — a fresh way to see how the community feels about each episode! 📊
With this new feature, you can now explore how users rated an episode through a clean horizontal bar chart. Each bar represents one specific rating — from 0.5 to 10.0 (in 0.5 increments) — showing exactly how many people gave that score.
It’s a quick, visual snapshot of audience sentiment: see if an episode split opinions or earned unanimous praise at a glance.
Whether you’re comparing fan favorites or checking where your own rating stands, Rates Distribution turns numbers into insight.
Update your app and discover how your ratings stack up with everyone else! 🌟
This feature is currently rolling out to our users, so expect it to be available in our next app update!